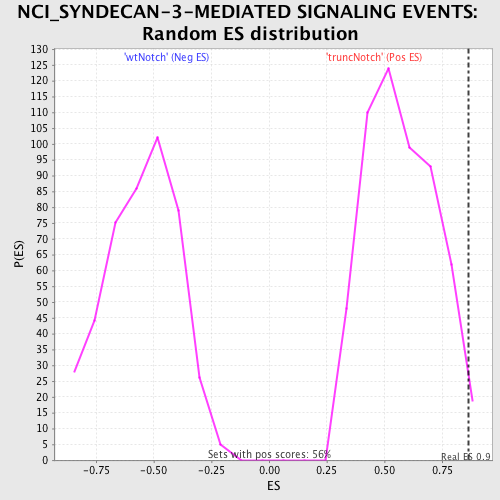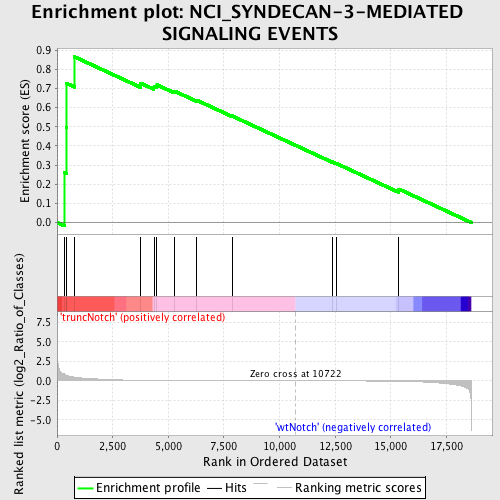
Profile of the Running ES Score & Positions of GeneSet Members on the Rank Ordered List
| Dataset | Set_03_truncNotch_versus_wtNotch.phenotype_truncNotch_versus_wtNotch.cls #truncNotch_versus_wtNotch |
| Phenotype | phenotype_truncNotch_versus_wtNotch.cls#truncNotch_versus_wtNotch |
| Upregulated in class | truncNotch |
| GeneSet | NCI_SYNDECAN-3-MEDIATED SIGNALING EVENTS |
| Enrichment Score (ES) | 0.8652246 |
| Normalized Enrichment Score (NES) | 1.5152818 |
| Nominal p-value | 0.01981982 |
| FDR q-value | 0.37607858 |
| FWER p-Value | 0.999 |
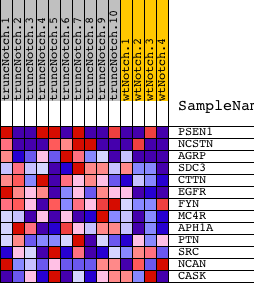
| PROBE | DESCRIPTION (from dataset) | GENE SYMBOL | GENE_TITLE | RANK IN GENE LIST | RANK METRIC SCORE | RUNNING ES | CORE ENRICHMENT | |
|---|---|---|---|---|---|---|---|---|
| 1 | PSEN1 | 130403 2030647 6100603 | 332 | 0.837 | 0.2619 | Yes | ||
| 2 | NCSTN | 940601 6400594 | 409 | 0.719 | 0.4978 | Yes | ||
| 3 | AGRP | 1990082 | 432 | 0.688 | 0.7265 | Yes | ||
| 4 | SDC3 | 460706 | 787 | 0.472 | 0.8652 | Yes | ||
| 5 | CTTN | 780154 1690538 3310017 4060717 | 3748 | 0.066 | 0.7282 | No | ||
| 6 | EGFR | 4920138 6480521 | 4355 | 0.047 | 0.7113 | No | ||
| 7 | FYN | 2100468 4760520 4850687 | 4488 | 0.044 | 0.7189 | No | ||
| 8 | MC4R | 430333 | 5273 | 0.029 | 0.6866 | No | ||
| 9 | APH1A | 4060273 4670465 6450711 | 6276 | 0.018 | 0.6389 | No | ||
| 10 | PTN | 5910161 | 7863 | 0.009 | 0.5567 | No | ||
| 11 | SRC | 580132 | 12358 | -0.005 | 0.3169 | No | ||
| 12 | NCAN | 1450400 3870239 4590440 6350438 7040332 | 12559 | -0.006 | 0.3082 | No | ||
| 13 | CASK | 2340215 3290576 6770215 | 15358 | -0.052 | 0.1751 | No |